Mosaic was created as a Google Summer of Code project by Chao Zhang in collaboration with the National Resource for Network Biology (NRNB). Please contact us with any feedback or questions.
And if you end up using Mosaic in your research, please cite this publication:
Chao Z, Hanspers K, Kuchinsky A, Salomonis N, Xu D, and Pico AR. Mosaic: Making Biological Sense of Complex Networks. Bioinformatics 2012, 28, 14:1943-4.
Mosaic is supported by the National Resource for Network Biology (P41 GM103504).
Note that Mosaic requires the CyThesaurus plugin, version 1.3.1 or higher:
Mosaic is an open source project. Feel free to contact us with any questions.
- Select a network to load under File>Import Network (Multiple File Types). The network can be in any of the Cytoscape supported network file formats.
- Start Mosaic by selecting Plugins>Mosaic.
- If this is the first time running Mosaic on your network, you will see a message in the Retrieve GO Annotations section of the Mosaic interface to download necessary databases. Click Download to continue. Mosaic will download the necessary database for your data. It is only necessary to download datbases once per species.
- Once database download is complete, Mosaic will prompt you to annotate your network with GO annotation. Click Annotate to continue. You can save the annotated network as a session file for future use. You can also re-annotate the network with the latest annotations from GO at any time by clicking Re-annotate.
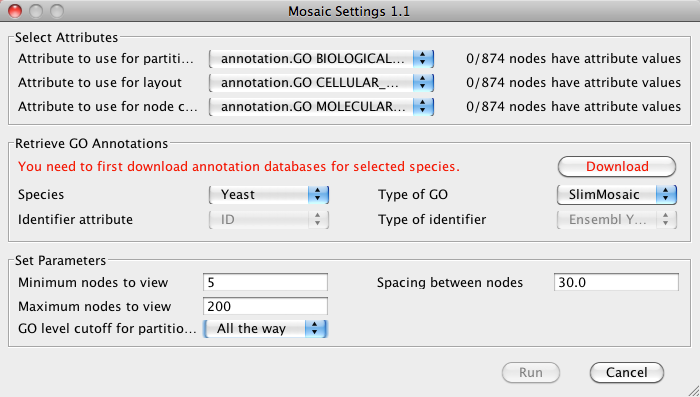
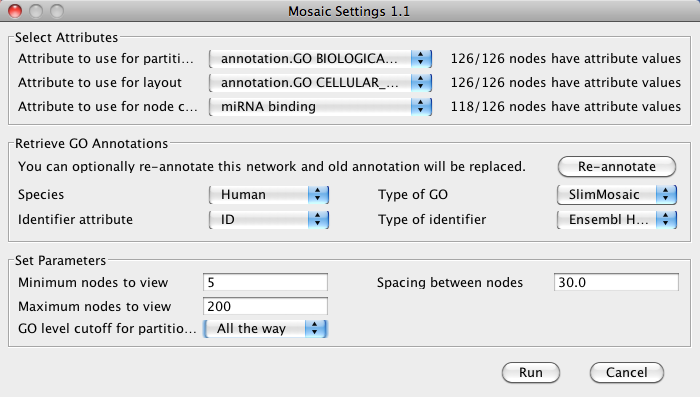
- In the Select Attributes section, verify that the
correct attributes are selected.
Note: It is possible to select node attributes other than GO annotation for partitiong and node color, but not for layout. Using alternate annotations involves importing annotation data prior to running Mosaic.
- In the Set Parameters section you can choose several
parameters that will directly affect the results of Mosaic:
- Minimum nodes to view: The minimum number of nodes in a subnetwork. Any subnetworks with fewer nodes will not be shown. Default is 5.
- Maximum nodes to view: The maximum number of nodes in a subnetwork. Any subnetworks with more nodes will not be shown. Default is 200.
- GO level cutoff for partition: The level of the GO hierarchy used for partitioning into subnetworks. Selecting a deeper level (larger number) results in a larger number of subnetworks. You can always drill deeper into a given subnetwork after running the initial partition. Default is 2. Note that for the purposes of this manual, GO level cutoff was set for "All the way", meaning to the deepest possible level of GO.
- Spacing between nodes: Spacing between nodes in a given subnetwork. Default is 30.
- Click Run to start Mosaic.
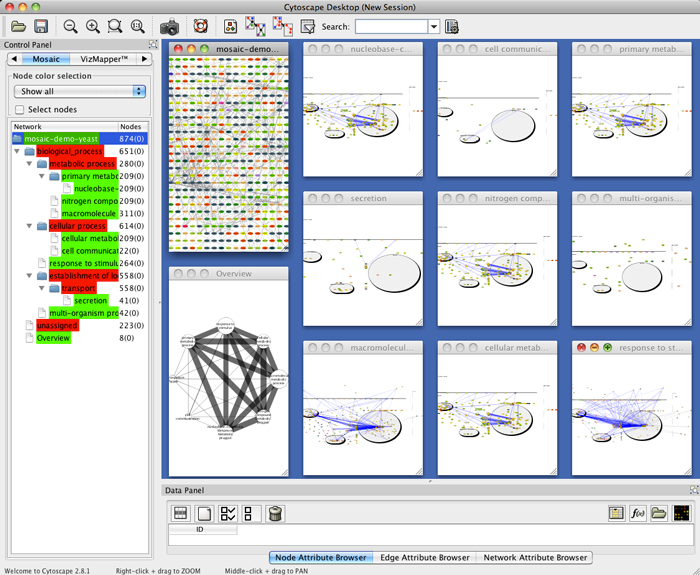
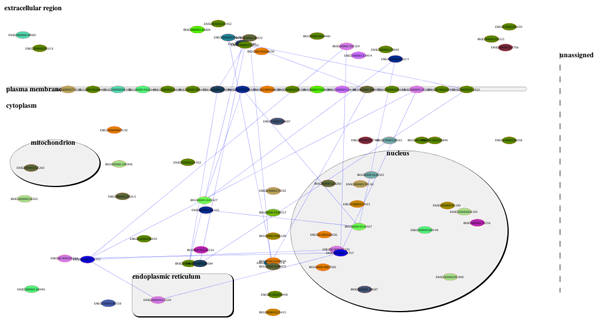
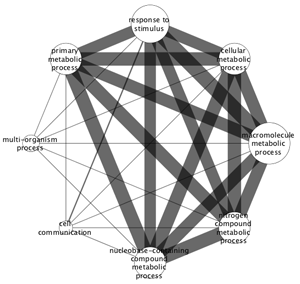
- To locate a particular subnetwork, select the network in the Mosaic side panel to highlight it in the tiled view.
- To view a particular subnetwork, click the Maximize button at the top left of the tiled window.
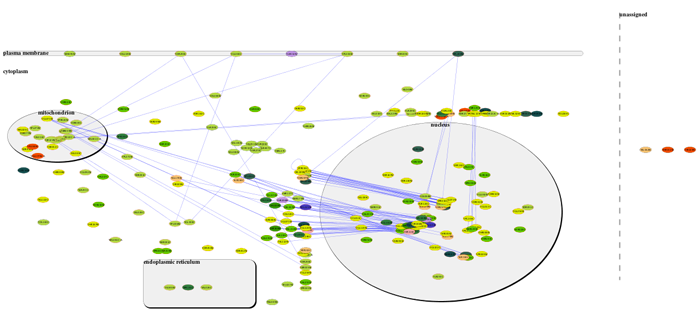
- Move nodes by click and drag to optimize the layout.
- Delete nodes and/or edges.
- Zoom in and out.
- Use the Network Overview Pane in the lower left corner of the Cytoscape window to navigate around the network.
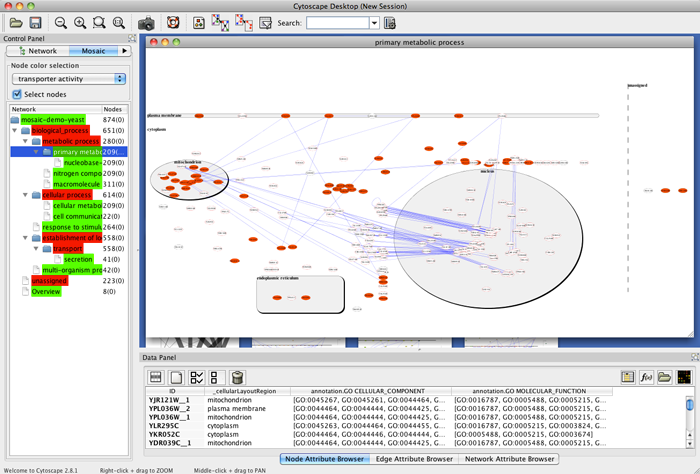
- Highlight a set of nodes to view associated attributes in the Data Panel. To add specific attributes to the display, click the Select Attributes button in the Data Panel and select the attributes you want to see from the list.
- Search for specific nodes by typing the name of the node in the Search field in the Cytoscape toolbar. If the node is found, this will refocus the network view on the node.
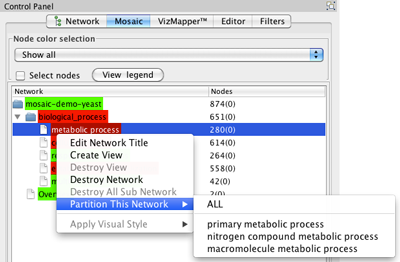
- Select a non-end branch by clicking on it in the Mosaic tab in the Control Panel.
- Right-click on the branch and select Partition This Network. You will be able to select a specific subnetwork to create, or you can select all.
In addition to the visual style that is applied to the overview network, the corresponding attribute values used to create the visual style is available as a set of node and edge attributes. The attributes are
- evidences: nodes classified in the GO/process (node attribute)
- subnetworkSize: number of nodes classified in the GO/process(node attribute)
- commonEvidences: nodes in common (edge attribute)
- overlapCount: number of nodes in common (edge attribute)
- After importing a network, go to File>Import>Attribute from Table (Text/MS Excel)... to open the Import Annotation File interface.
- Select the annotation file. In the Advanced section, select Show Text File Import Options. In the Attribute Names section, select Transfer first line as attribute names.
- In Advanced, select Show Mapping Options and verify that the correct column in the annotation file is mapped to the appropriate network attribute (i.e. matching identifiers).
- In the Preview section, deselct columns that you don't want to import by clicking on the column header. The column should be
highlighted in grey if de-selected. The interface should now look like this:
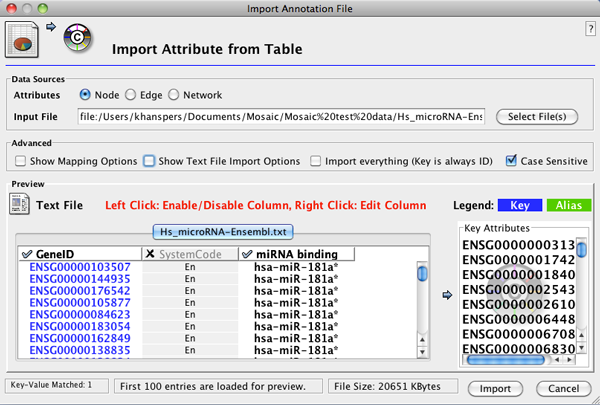
- Click Import to start the import.
- When import is finished, select a few nodes in the network and verify in the Data Table that the annotation was imported correctly.
- Start Mosaic. In the Select Attributes section, select the imported attribute under Attribute to use for node coloring.
Click Annotate to annotate the network with GO for partitioning and layout.
- Each subnetwork will now be colored based on the predicted miRNA binding sites.